
Using Sports Interest to Improve Data Analytics Learning
How contextual design and attention skills shape performance in STEM dashboards?
The Problem
STEM education and EDU-tech organizations increasingly rely on dashboards, analytics platforms, and data-driven decision-making. Yet many learners struggle to build data literacy, not because the tools are too advanced, but because analytics training is often abstract, cognitively heavy, and emotionally disengaging.

Dropout rates in STEM and low adoption of analytics tools point to the same issue:
People disengage when learning feels disconnected from real life.
This project asked a practical question relevant to education leaders, product managers, and analytics teams:
Can familiar, real-world contexts (sports) make analytics learning more effective, and for whom does it work best?
What I studied?
Visual Search Propensity
An individual’s ability to efficiently scan dashboards, locate relevant information, and ignore noise.
Contextual familiarity
How familiar learners are with the domain used in the dashboard (sports).
Rather than assuming “better design works for everyone,” this study looks at who benefits most, and why.
Methodology
Two empirical studies were conducted. The first part of the study happened in "Tech3Lab", as a controlled laboratory experiment in Canada. The video demonstrates the user research experiment.

The second part of the study took place in India as a cultural counterpart to compare how users perceive sports across different cultural backgrounds.
Both used a within-subjects design, allowing individual cognitive traits and contextual familiarity to be measured precisely. Ethical approval was obtained prior to data collection
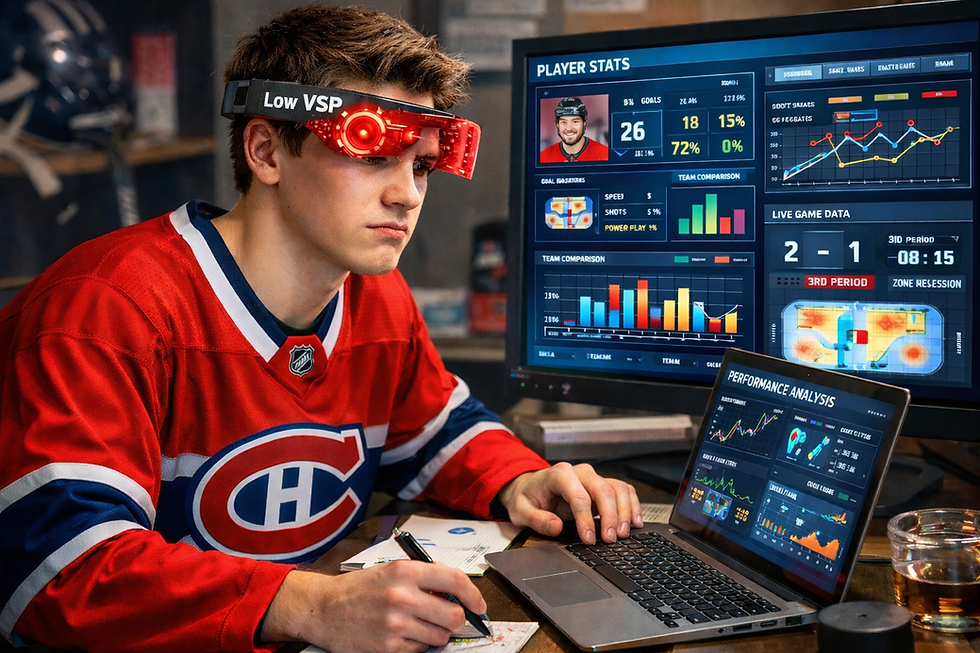
The learning environment

Participants learned analytics through a sports-based simulation game "Business Builders" built on SAP Analytics Cloud, where they had to:
-
Read dashboards and charts
-
Track performance metrics
-
Make decisions under time pressure
The video tutorial created by us were played to all participants on "how to play?" the game.
Sports were used deliberately because they are globally recognized, emotionally engaging, structurally rich (scores, trends, comparisons).
This mirrors how business dashboards work in real organisations.
Collected Data (multi-layered by design)

The research model guided the data collected during the experiment by capturing multiple dimensions of the learning experience simultaneously. It was designed to examine how individual attention abilities and contextual familiarity influence performance in a visual analytics environment. Objective performance data were collected through task accuracy and completion time. Perceived cognitive effort during interaction with the dashboard was measured to understand mental workload. Individual visual search ability was assessed separately using controlled attention tasks that evaluated how efficiently participants could locate relevant information and ignore distractions. Emotional responses during task execution were recorded to capture engagement and affective experience. Finally, overall user experience was measured through perceived ease of use, enjoyment, and satisfaction. This integrated approach allowed the study to analyse not only whether participants performed well, but how cognitive load, attention, emotion, and familiarity interacted to shape performance outcomes.
Data Collection Tools

Visual search tasks to measure visual search propensity

Webcam-based face reader for emotional recognition

Electrodermal activity (EDA) sensors for physiological responses

Tobii Vision Pro for advanced eye-tracking and pupillometry data

Qualtrics survey platform for self-reported measures
Key Results
Familiarity Improves Experience - Not Automatically Performance
Familiarity with the sports context consistently enhanced participants’ subjective experience of the analytics platform. Learners who were more familiar with the domain reported greater enjoyment, higher perceived usability, and stronger overall satisfaction. However, familiarity alone did not automatically translate into improved task performance. While contextual design clearly supported engagement and adoption, it was not sufficient by itself to guarantee better accuracy or faster completion times. This suggests that deeper cognitive mechanisms, beyond surface-level engagement, drive effectiveness in complex dashboard environments.
Visual Search Propensity Alone Is Not Sufficient
Visual Search Propensity, reflecting individual differences in attentional efficiency, did not independently predict superior performance across all conditions. Although some learners demonstrated strong visual search ability, this did not universally result in better task outcomes. This finding challenges the assumption that attentional skill alone ensures success in visually complex systems. Ability without contextual alignment did not consistently produce performance advantages.

The Interaction Effect: The Core Insight
The most important insight emerged from the interaction between contextual familiarity and visual search propensity. When familiarity with the sports context was high, learners with stronger visual search ability experienced lower cognitive load, higher attentional engagement, and more positive emotional states during task execution. Under these aligned conditions, performance improved significantly in both accuracy and speed. In contrast, when contextual familiarity was low, the advantage associated with strong visual search ability diminished. In other words, attentional talent delivered measurable benefits only when the learning environment was contextually meaningful to the learner.


Cross-Cultural Findings
Cross-cultural comparison reinforced this interaction effect. Participants in India, who demonstrated higher overall familiarity with the sports context, consistently reported greater enjoyment, stronger perceived usability, and higher engagement compared to the Canadian sample. Importantly, both groups interacted with the same analytics platform and completed the same tasks. The difference in outcomes was not driven by system design, but by contextual resonance. This highlights the critical role of cultural familiarity in shaping cognitive experience and learning performance within visual analytics environments.
Discussions
This research shows that effective analytics learning emerges from alignment between human cognitive traits and contextual meaning. Visual search efficiency determines how fluently learners navigate complex dashboards, while contextual familiarity determines how intuitively those dashboards are interpreted and how motivated learners remain.
Familiar contexts reduce extraneous cognitive load by activating prior schemas, allowing working memory resources to be allocated toward meaningful problem-solving. At the same time, contextual resonance enhances intrinsic motivation by satisfying psychological needs for competence and relatedness. When attentional efficiency and contextual familiarity reinforce each other, learners experience lower mental effort, stronger engagement, and improved performance.
The implications extend beyond education into product design and organisational training. Analytics platforms and dashboard systems should not assume uniform visual literacy across users. Designing cognitively efficient interfaces is necessary but insufficient. Contextual alignment—embedding tools within familiar and culturally relevant domains—can significantly amplify learning outcomes.
As organisations continue investing in analytics capability and digital transformation, the key insight is clear: learning effectiveness is not driven purely by technological sophistication. It is driven by how well systems are designed to match human cognition and contextual experience. When cognitive efficiency and contextual familiarity align, performance improves, satisfaction increases, and learning becomes sustainable.
Acknowledgements
I would like to express my sincere gratitude to my thesis supervisor, Dr. Pierre-Majorique Léger, for his guidance and mentorship throughout this research journey. I am also thankful to my co-supervisor, Dr. Olivier Caya, for his clarity and thoughtful feedback, which greatly strengthened the structure and rigor of this work.
My appreciation extends to Dr. Constantinos Coursaris and Dr. Sylvain Sénécal for their support during my coursework and thesis development. I am grateful to the Tech3Lab team for their assistance throughout training, data collection, and analysis, and to Shang Lin for his expertise and support in advanced statistical analysis.